What is an operating model?
Business language is full of jargon. Even worse, much of the jargon means different things to different people. And the place where these problems loom largest is around strategy and how it should be executed.

The word strategy itself has many meanings. The phrase strategic plan has even more interpretations. Then there are words like goals, objectives, scorecards and targets that are used in many different ways. The phrase “business model” has resonance, but no two managers or consultants use the same definition. The phrases “operating model” and “target operating model” are no different.
So lets to start with a definition.
“An operating model is a visualisation (i.e. model or collection of models, maps, tables and charts) that explains how the organisation operates so as to deliver value to its customers or beneficiaries.”
In its simplest form, an operating model is a value delivery chain: a sequence of steps that describe the main work of the organisation. Lets take this article as an example. You, the reader, are the beneficiary to whom this article is intended to deliver value. If you are reading this article through the PEX website or newsletter the value chain is shown in figure 1
Figure 1
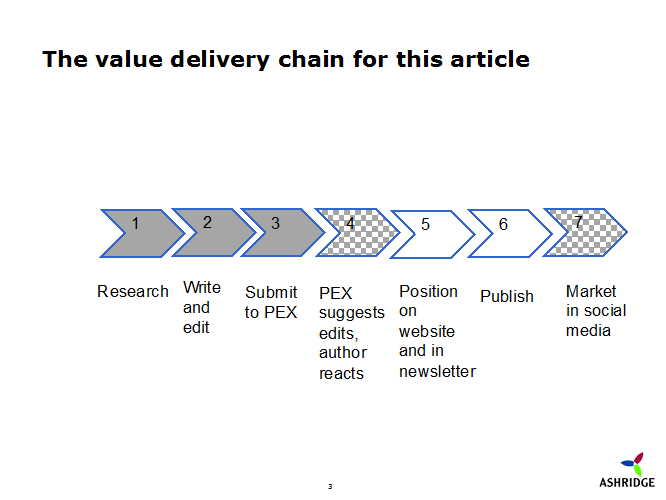
Of course, as the author of this article, I am directly involved only in the steps coloured in grey, which includes a part role in step 4 (editing) and in step 7 (social media marketing). The same is true for other organisations involved in this chain: PEX engages in part of the chain, and social media sites in another part.
So the operating model of an organisation covers those parts of the value delivery chain that the organisation engages in as well as how the organisation interacts with the other participants.
The phrase “value delivery chain” comes from the strategy guru Michael Porter, and figure 2 reproduces his visual representation of the concept[i]. As you can see, he focuses not just on the steps in the production process that convert “inputs” into “outputs” for “customers”, but also on supporting functions and activities such as financial management, information technology and human resources. Any organisation of more than a handful of people is likely to have specialists focusing on these supporting functions in addition to the operating people who are creating and delivering the value. The distinguishing feature of these supporting functions is that they support all of the delivery functions rather than being one of the steps in the deliver chain.
Figure 2

So building on Porter’s thoughts, a full operating model will address all the work that needs to be done: the support functions as well as the value chain steps. But a full operating model will do more than lay out the work to be done. It will address:
- Organisation model: how the activities in the value chain and the support functions link together into an organisation structure.
- Cross-structure governance: how processes and activities that cut across the structure of the organisation are managed and governed (particularly information links)
- Decision rights: how the most important decisions in the organisation are taken
- Management rhythm: what meetings and with what frequency are used to set objectives, make plans and manage performance
- People model: the types of people that the organisation wants to attract, how these people will be paid and incentivised, what they will be held accountable for and the values that should guide their behaviour.
- Business partners: which organisations are partners rather than transactional suppliers and what sort of partnership relationship is required with each.
- Location footprint: where the work and assets are located and why
An operating model converts all these topics into models, maps and charts that help communicate how the organisation works:
- a map of the value delivery chains, showing the organisation’s involvement in each step – most organisations have more than one value delivery chain
- an organisation chart in the form of an organisation model
- a table laying out the type of people, incentives, accountabilities and culture
- a table showing the cut-across processes and information needs and who “owns” these processes
- a grid of the major decisions and the role of each senior manager in the structure with regard to each decision
- a matrix explaining what is insourced and outsourced and which external suppliers are business partners
- a map of the locations explaining the role of and assets at each location
- a timetable showing the rhythm of management meetings used to run the organisation
I use the word POLIST to help me remember the different aspects of an operating model that need to be addressed. “P” for the process steps that make up the value delivery chains. “O” for the organisation model that is needed to connect the processes and the support functions, for the people model and for the decision grid laying out how major decisions get made. “L” for locations and the assets that exist at these locations. “I” for information and other cross-organisation or cross-location links. “S” for suppliers and business partners. “T” for a timetable showing the rhythm of management meetings used to run the organisation.
In plain English, an operating model should display the work that needs to be done in the organisation (P), the type of people and culture needed to do this work, how these people are connected together in an organisation structure, how important decisions are made (O), where the people and assets are located (L), how the people work together across the structure and locations (I), what other organisations are needed to support the work (S) and how the people are managed through regular planning, budgeting and performance review meetings (T).
Figure 3 – The Operating Model Canvas – is a single framework for displaying all of these different parts of an operating model. The Canvas has limited capacity; so only the highest-level thoughts can be included. For more detail, separate charts and models are needed for each section of the Canvas. Figure 4 is an example of some of the high-level post-it-notes that you might place on the Canvas if you were summarizing the operating model of McKinsey & Co the global strategy consulting firm.
Figure 3 – The Operating Model Canvas
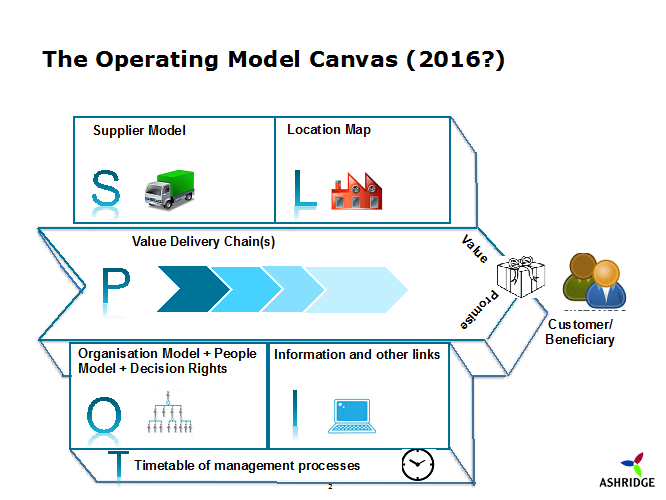
Figure 4 – Operating Model Canvas for McKinsey

Source: Authors experience
Andrew Campbell is a Director of Ashridge Business School and runs a 3-day executive course titled Designing Operating Models www.ashridge.org.uk/dom. Andrew has written more than ten books on strategy and organisation. He blogs on operating models at www.ashridgeonoperatingmodels.com
[i] Porter, M.E. (1985) Competitive Advantage, Free Press, New York, 1985.